


New article
Recently updated
Viewing and analysing LNAM arrival performance

Who is this article for?Noise analysts who need to review and report on LNAM arrival performance.
Access to the ANOMS Noise Analyst Workbench is required. LNAM only applies where it is enabled and configured for your site.
Low Noise Arrival Metric (LNAM) tags categorise operational records into zones A, B and C, which you can view in the Operations Browser, query using the Query Generator, and visualise on Track Profile Graphs.
Viewing LNAM tags in the Operations Browser
Operational records are characterised for LNAM using the Data Tags column, with the values LNAM A, LNAM B and LNAM C. The Tags column is visible in the Operations Browser, and the tags are also visible when viewing a record in the Operations Editor.
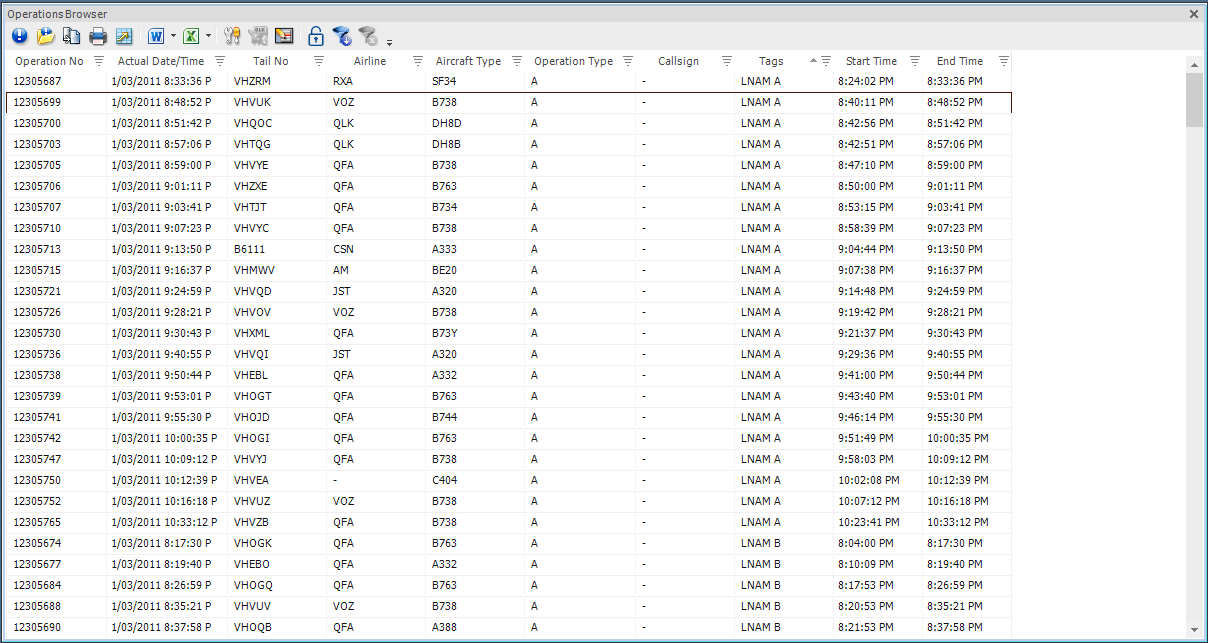
The Operations Browser with the Tags column showing LNAM A and LNAM B categorisations for arrivals
You can use in-browser filtering on the Tags column to narrow the selection to particular zones.
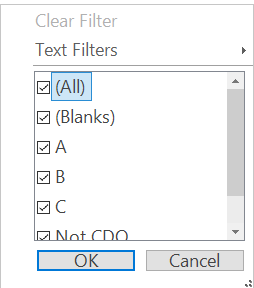
In-browser filtering on the Tags column, selecting LNAM zone values
Querying LNAM zone segments
You can use the Query Generator to search for operations assigned to different zones, or use the LNAM criteria as report output. The Low Noise Arrival relation provides the zone-segment fields: Id, Operation No., Entry Time, Exit Time, Ground Distance Metres and Zone.
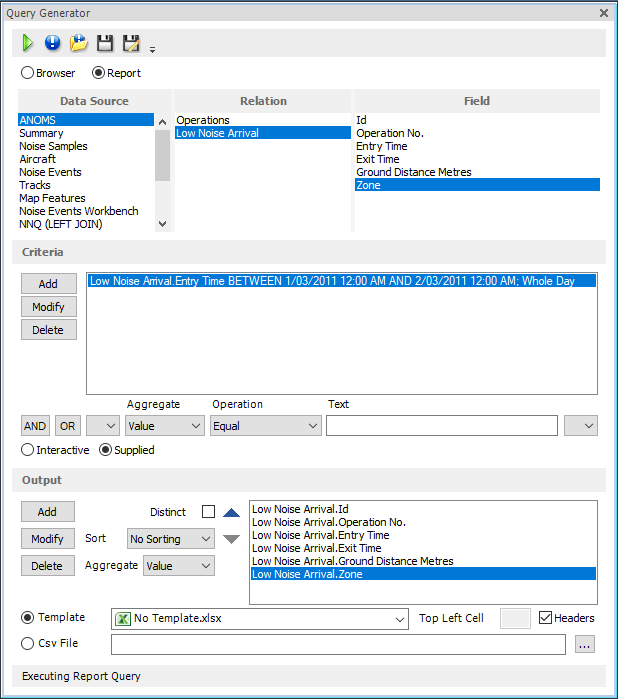
A Report query on the Low Noise Arrival relation, outputting the zone-segment fields for a chosen date range
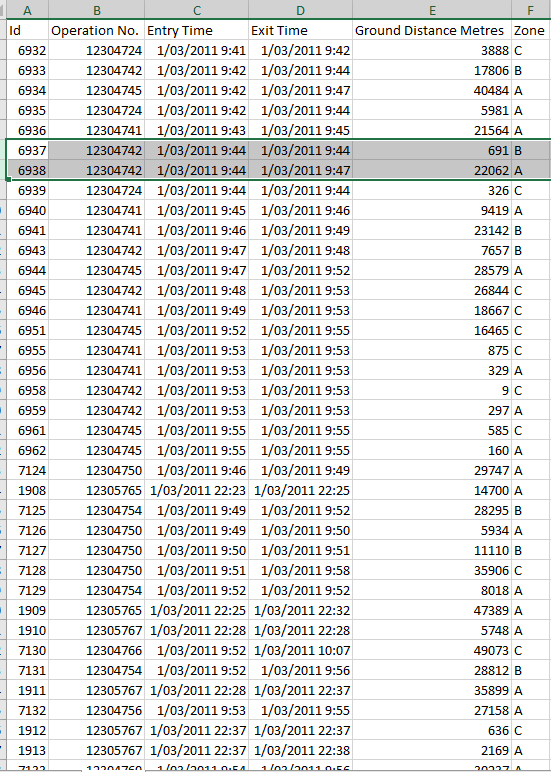
Query results — one row per zone segment, with entry and exit times, ground distance and zone for each operation
The output columns are:
Column | Description |
ID | Unique consecutive ID number for each zone segment |
Operation Number | The operation number for the operation; the same operation appears on multiple rows when its descent profile changed between zones during the arrival |
Entry Time / Exit Time | The times the operation entered and exited that low-noise zone |
Zone | The zone description (A, B or C) |
Ground Distance Metres | The ground distance travelled between the entry and exit times |
Visualising LNAM on the Track Profile Graph
Arrivals and their LNAM performance can be visualised using the standard Track Profile Graph when its properties are changed to display LNAM segments.
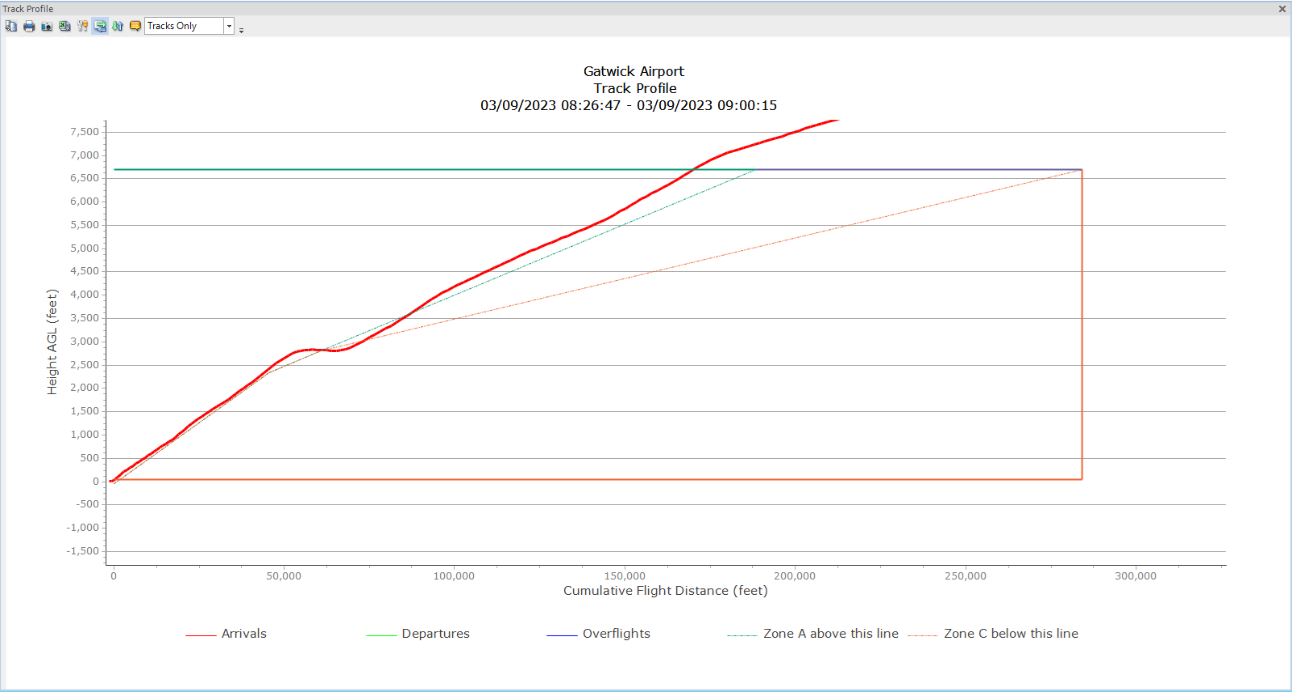
The Track Profile Graph displaying LNAM zone boundary lines against an arrival's descent profile
When LNAM display is enabled, the graph shows:
- a top coloured line representing the altitude at which the metric begins assessing the descent
- a green line representing the A zone boundary
- a blue line representing the B zone boundary
- an orange line representing the C zone boundary
- a lower orange line showing where LNAM assessment finishes — normally ground level
An operation can spend most of its descent in the A zone but dip below a boundary late in the approach and still qualify for a lower tag, because the overall tag reflects the worst segment. As the Track Profile Graph is a multi-use graph, the legend identifying operation types remains for other use cases.
Using the Low Noise Arrival properties panel
The graph's Operation Track Properties window includes a Low Noise Arrival tab.
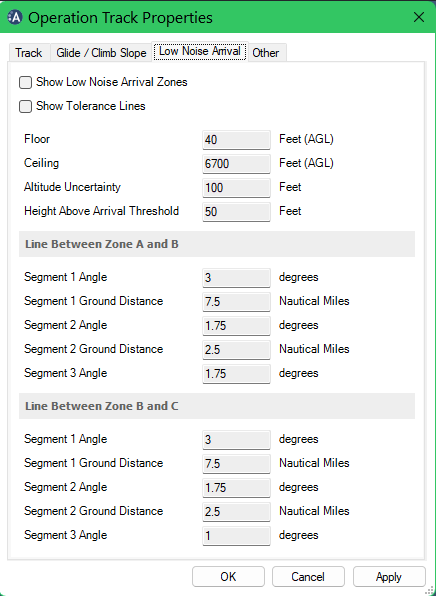
The Low Noise Arrival tab of the Operation Track Properties — display toggles at the top, with the zone boundary parameters shown for reference
The configurable items are the two checkboxes at the top, which toggle the Show Low Noise Arrival Zones and Show Tolerance Lines displays on or off.
Note: The remaining fields — the floor, ceiling and zone boundary segment angles and distances — are for reference only. These parameters were approved by an aviation authority and are set during site configuration; they cannot be edited here.