


New article
Recently updated
Understanding the Low Noise Arrival Metric (LNAM)

Who is this article for?Noise analysts at UK airports who want to understand the Low Noise Arrival Metric.
Access to the ANOMS Noise Analyst Workbench is required. LNAM only applies where it is enabled and configured for your site.
The Low Noise Arrival Metric (LNAM) measures how well arriving aircraft fly a steep, low-noise descent profile, as proposed in the UK CAA's CAP 2032 document.
Understanding the background
Previously, the Continuous Descent Operation (CDO) algorithm was applied to arrivals, monitoring for segments of level flight. Further procedures were developed to refine and reduce the noise profile of arriving aircraft.
Analysis of flight profiles showed that a steep angle of descent produces the best low-noise profile, but too steep an angle results in higher drag, which increases noise again. Different airframes also cannot maintain both descent and deceleration at certain angles, leading to variation in arrival profiles by aircraft type.
Note: LNAM analysis only applies where the feature has been enabled and configured for your site.
Defining the zone boundaries
To incentivise low-noise arrival performance, two height boundary conditions are defined, creating three height zones (low-noise categories) labelled A, B and C.
The upper (A/B) boundary comprises:
- A line starting at 50 ft above the landing runway threshold, extending out to 7.5 NM at an angle of 3 degrees
- A line at an angle of 1.75 degrees between 7.5 NM and 10 NM
- A line at an angle of 1.75 degrees between 10 NM and the 6,700 ft ceiling
The lower (B/C) boundary comprises:
- A line starting at 50 ft above the landing runway threshold, extending out to 7.5 NM at an angle of 3 degrees
- A line at an angle of 1.75 degrees between 7.5 NM and 10 NM
- A line at an angle of 1 degree between 10 NM and the 6,700 ft ceiling
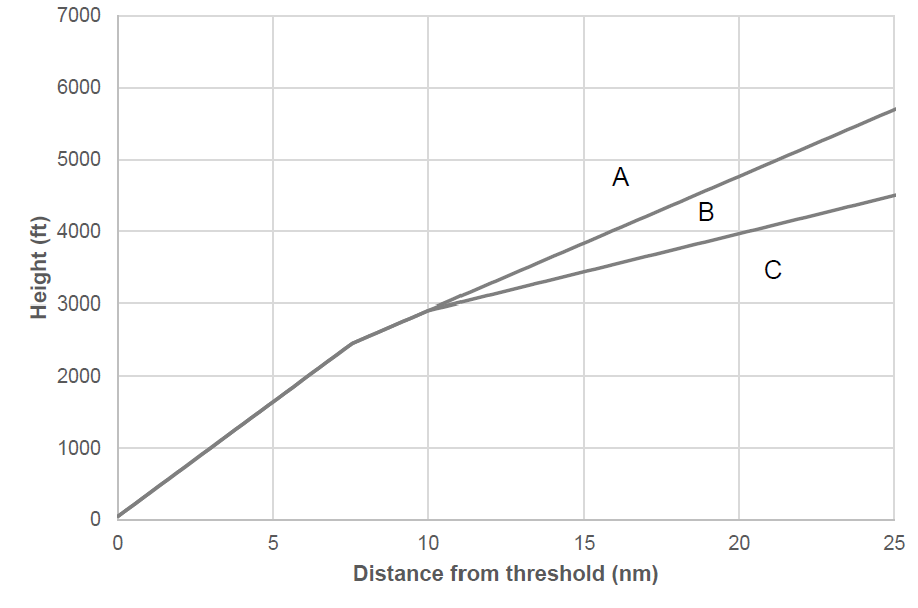
The three LNAM zones — A above the upper boundary, B between the boundaries, and C below — plotted as height against distance from the runway threshold
The assessment starts at a fixed ceiling value above aerodrome level. The ceiling (default 6,700 ft above aerodrome level) and floor (default 50 ft above aerodrome level) are adjustable, but only as part of site configuration by Ideagen.
Categorising arrivals
ANOMS analyses all arrivals for the airport and places Data Tags on the operations, categorising them into zones A, B or C. Aircraft rated in the A zone flew the best (quietest) profile; B and C are progressively less desirable.
An operation may contain more than one zone segment, as the aircraft changes descent profile to adjust for the runway threshold or airspeed. The operation's overall tag reflects its worst segment:
Tag | Meaning |
LNAM A | The operation only has A segments |
LNAM B | The operation has one or more B segments, but no C segments |
LNAM C | The operation has one or more C segments |
Understanding expected distribution
Testing indicates that the criteria rate roughly 45–50% of arrivals in the best category (A), around 15–20% in the second category (B), and 35–40% in the lowest category (C).
Analysing LNAM performance in ANOMS
Once LNAM is enabled for your site, every arrival carries an LNAM zone tag, and ANOMS provides browser, query and graph tools for assessing and reporting on performance.