


New article
Recently updated
Creating and viewing a Track Density plot

Who is this article for?Noise analysts who need to generate and display a Track Density plot.
Access to the ANOMS Noise Analyst Workbench is required.
A Track Density Task represents a Track Density plot's full life cycle: creation, processing, viewing and deletion are all carried out on the task.
Understanding how Track Density Tasks work
A Track Density Task is composed of a Grid Definition and a list of flights to process through that grid. As the flights pass through the grid, the number of times a flight intersects each grid square is counted, and this count is used to draw the Track Density plot on the map. Grid Definitions are created with the Grid Definition Manager.
The flights come from one of two sources:
- the set of flights currently selected in the Operations Browser
- a saved Query Generator query
Note: The query used must be a browser-based query that outputs data to the Operations Browser, and it must not contain any interactive-based fields — interactive fields cause the processing to fail.
Opening the Track Density Manager
To access the Track Density Manager:
- From the Main Menu, click Data.
- Click Track Density.
- Choose Track Density Manager.
The Track Density Manager window displays, giving access to all Track Density Task functions.
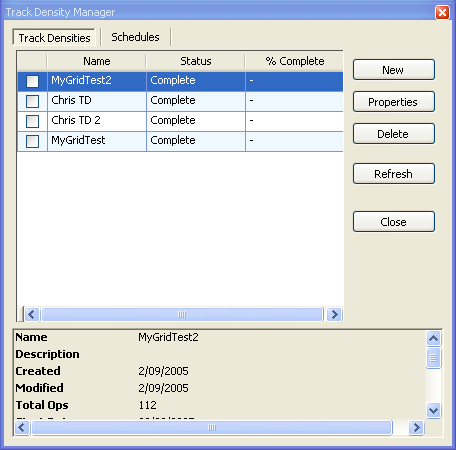
The Track Density Manager listing tasks with their status and completion percentage
Creating a Track Density Task
To create a Track Density Task:
- In the Track Density Manager, click New.
- In the Name box, type the name of the Track Density Task.
- In the Description box, type text that describes the task.
- From the Grid list, select the required Grid Definition.
- In the Data Source group, select how the tracks are chosen:
- Select Query and choose a saved query from the drop-down list
- Select Map to use the flights currently selected in the Operations Browser (this option is not available if no flights are selected)
- Click OK.
The Track Density Task is created and added to the Track Density Manager's list.
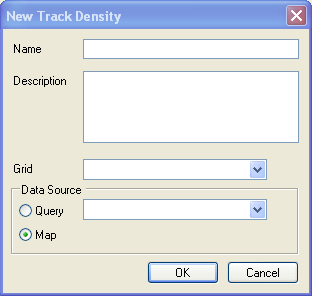
The New Track Density dialog with the grid selection and the Query or Map data source options
Monitoring processing progress
To monitor the task's progress:
- In the Track Density Manager, click Refresh.
The % Complete column updates to show the task's progress.
Note: Once a map-based task has been submitted for processing, the flights on the map can be removed from the display — they are no longer required for the task to complete.
Displaying a Track Density plot
To display a Track Density plot:
- Ensure the map is open.
- In the Track Density Manager, select the checkbox of the required Track Density.
The plot appears on the Map Browser.
To remove a Track Density from the map, clear its checkbox.
Viewing the Track Density legend
The legend shows the count ranges used to colour the Track Density alongside the colour that represents each range. The ranges can be viewed as actual counts or as a percentage of the total number of flights given to the task for processing. For example, if 1,000 flights were processed and one range represented 100–160 flights, that range would be shown as 1%–1.6%. Percentages can be useful when showing members of the community how many flights pass over or around their area relative to the airport's total.
To view the Track Density legend:
- In the Feature Manager, click Tracks.
- Under Legend Display, click Track Density.
- To view the ranges as percentages, select Display as %.
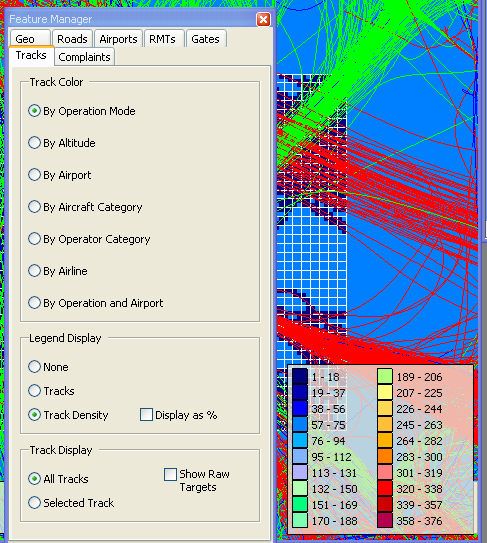
The Feature Manager Tracks tab with Track Density selected as the legend display, alongside a Track Density plot on the map
Viewing an individual cell count
You can view the count for any individual grid cell.
To view an individual cell count:
- On the Map Browser, right-click and select Properties.
- Click a grid cell.
The count, along with the name of the Track Density it belongs to, is displayed in the Map Properties window.
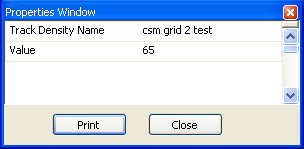
The Properties window showing the track count for an individual grid cell