


New article
Recently updated
Viewing real-time noise, weather and radar feeds

Who is this article for?Noise analysts who need to watch live noise, weather and radar data as it arrives.
Access to the ANOMS Noise Analyst Workbench is required. Live device feeds must be available at your installation.
ANOMS can display live data feeds — one-second noise levels, weather conditions and radar flight tracks — from the devices connected to your system.
Opening the Real Time Device Manager
The Real Time Device Manager displays all the real-time devices connected to the ANOMS system. The data comes directly from the devices; it is not stored in the database.
Note: Real-time feeds require live noise monitor, radar or weather connections. Availability depends on your installation and configuration.
To open the Real Time Device Manager:
- Go to the Data menu.
- Click Realtime Devices.
- Select Realtime Device Manager.
The Real Time Device Manager dialog box appears, listing each device with its name, device type (Noise, Weather or Radar) and connection status.
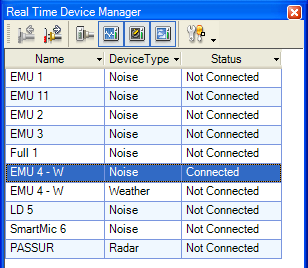
The Real Time Device Manager, listing devices with their type and connection status
Using toolbar commands
The toolbar buttons control connections and filter the device list. The Show buttons are toggle buttons: when pressed on, they show only the real-time devices currently connected.
Command | Definition |
Connect | Connects ANOMS to the selected device for a live data feed |
Disconnect | Disconnects ANOMS from a live data feed |
Show Connected | Displays only the devices currently connected to ANOMS with real-time data feeds |
Show Noise Devices (toggle) | Displays only the devices currently connected with a real-time noise feed |
Show Radar Devices (toggle) | Displays only the devices currently connected with a real-time radar feed |
Show Weather Devices (toggle) | Displays only the devices currently connected with a real-time weather feed |
Radar Properties | Displays the Radar Properties dialog box, which controls the details displayed on the Map Browser |
Viewing real-time noise
The real-time noise graph displays data for all noise monitors currently connected and providing a data feed. Real Time Noise can be displayed in two ways: as a graph in real time, or as noise levels shown at the monitors on the Map. The Real Time Noise window displays the one-second Leq data from the selected noise monitors.
To start Real Time Noise:
- In the Real Time Device Manager, select the device.
- Do one of the following:
- Click Connect
- Go to the Data menu and click Realtime Noise
The Real Time Noise graph appears.
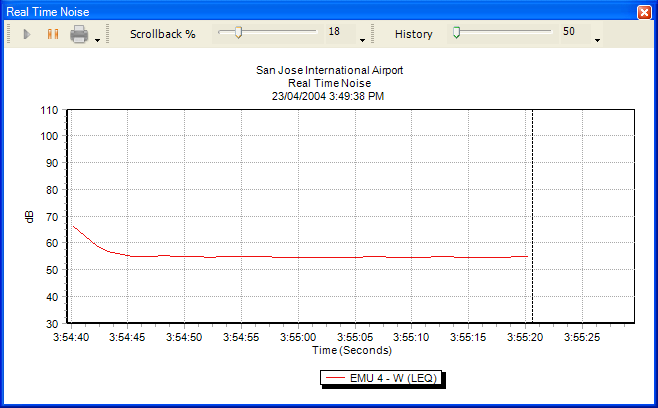
The Real Time Noise window, plotting one-second Leq values for a connected monitor
Understanding the Real Time Noise window
The Real Time Noise window contains the typical title bar, menu bar, toolbar and message area, as well as a connection area and noise graph area. The toolbar provides three action buttons (Start, Pause and Print) and two slider controls for adjusting the display of the noise data.
Function | Definition |
Play | Starts playing the noise data |
Pause | Temporarily stops the display of noise data in the noise graph area |
Resume | Restarts the display of noise data; available only when the display is paused |
Prints a copy of the graph to a local or network printer | |
Scrollback % | Controls the percentage of time that the right side of the divider is blank |
History | Controls the number of seconds of data displayed on the screen |
To adjust the sliders:
- Move the Scrollback slider to the left to see less scroll-back (a smaller blank area on the right of the graph)
- Move the History slider to the right to see more history (more seconds of data on the graph)
Viewing real-time weather
The Real Time Weather window displays weather conditions at remote Locations equipped with a weather station. A weather station contains equipment to measure wind speed and direction, temperature and humidity. These values are displayed in the window as they occur, in real time, at the remote Location.
To start Real Time Weather:
- Do one of the following:
- Go to the Data menu and click Realtime Weather
- In the Real Time Device Manager, select the device and then click Connect
The Weather Station window appears.
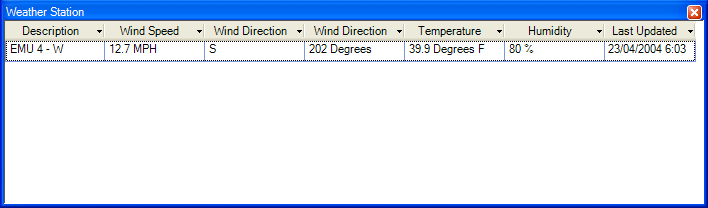
The Weather Station window, showing wind speed, wind direction, temperature and humidity for a connected station
Viewing real-time radar
Real-time radar feeds can be displayed on the Map. Tracks can be displayed with flight number, aircraft type, altitude, beacon code and track ID, and you can also control the tail length of each track.
To start the real-time map display:
- In the Real Time Device Manager, click the required radar feed.
- Click Connect.
The flight tracks appear on the Map Browser.
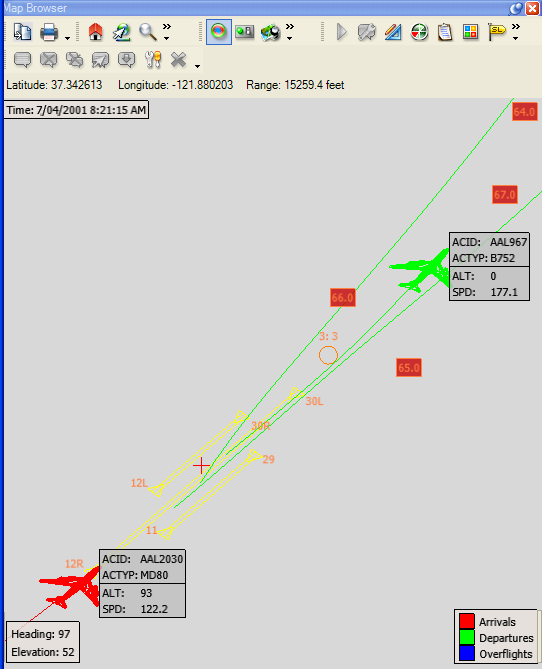
Real-time radar tracks on the Map Browser, with tag boxes showing aircraft details
Configuring radar properties
The Radar Properties dialog box controls which details (tags) are displayed against each track on the map.
To configure radar properties:
- In the Real Time Device Manager, click Properties.
- Under Tag Items, select the check boxes for the items you want displayed: Aircraft ID, Aircraft Type, Altitude (feet), Beacon Code, Ground Speed (knots), Track ID, Origin Airport or Destination Airport.
- Set Tail Length (# points) if required.
- Click OK.