


New article
Recently updated
Understanding Track Profile graphs

Who is this article for?Noise analysts who need to view and interpret flight altitude profiles.
Access to the ANOMS Noise Analyst Workbench is required.
The Track Profile window displays and prints altitude versus distance profiles for flight tracks, allowing you to graph individual or multiple flight track profiles from the tracks currently displayed in the Map Browser.
Before you begin
Note: Flight tracks must first be loaded into the Operations Browser before they can be graphed in the Track Profile window. Tracks loaded with Replay cannot be used with the Track Profile window.
Understanding graph axes
The Track Profile graph uses two axes to display flight information:
- X axis (Cumulative Flight Distance): horizontal (ground track) distance along the flight track
- Y axis (Above Airport Elevation): vertical distance of the aircraft above airport ground level along its flight track
Understanding the zero point
Track profiles are drawn so that the zero, zero point on the graph represents the start of the runway for each flight track shown. What counts as the start of runway depends on the operation type.
Arrivals
For an arrival flight track, the zero, zero point is the runway end the aircraft is arriving to (the runway end nearest the touch-down point). If radar data points for an arrival extend beyond this point, that part of the track is shown with negative X values, extending to the left of the zero, zero point.
Departures
For a departure flight track, the zero, zero point is the beginning of the runway the track is associated with (the runway end at the start of the take-off roll). Departure tracks are shown with positive X values and do not extend left of the zero, zero point.
Overflights and other tracks
Overflights and other tracks not associated with a runway start at x = zero where they were first picked up by the radar, with the Y value set to the first reported altitude.
Important: If a track is not associated with a runway (runway field = UNKNOWN), the track starts at x = zero in the Track Profile graph.
Viewing a track profile
The Track Profile window can display either a single, selected flight track or multiple flight tracks.
To view a track profile:
- Populate the Operations Browser and display the tracks on the Map Browser.
- In the Operations Browser, click Graph (Track Profile).
The Track Profile window appears.
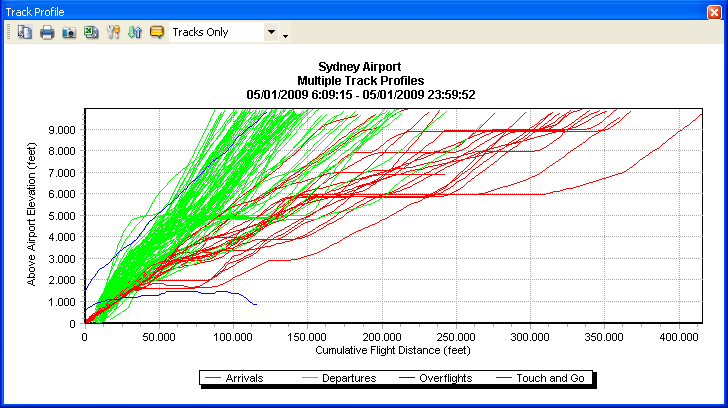
Multiple track profiles graphed together, colour-coded by operation type
The Tracks button in the Track Profile toolbar toggles between One Track and All Tracks display mode.
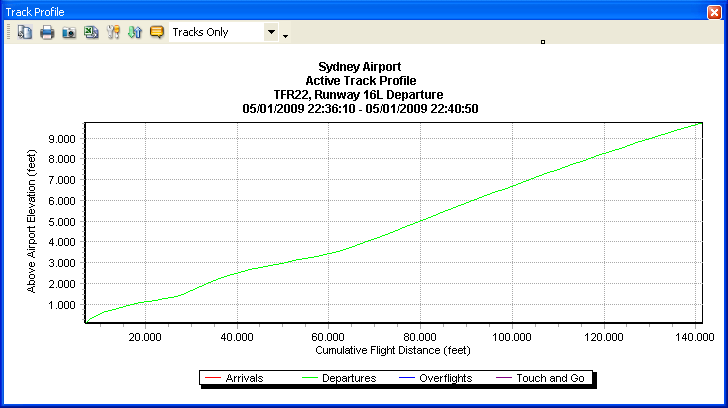
A single departure track profile displayed in One Track mode
Viewing ground speed
You can view the ground speed of the operation on its own, or together with the track profile.
To view ground speed:
- To view ground speed only, select Ground Speed Only from the profile type list.
- To view both ground speed and track, select Tracks & Ground Speed from the profile type list.
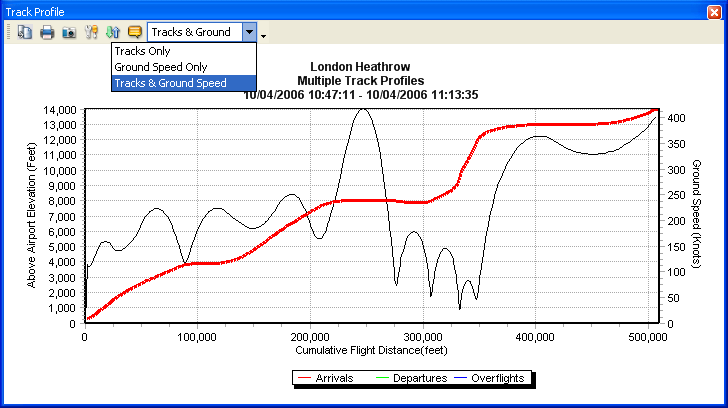
A track profile with the ground speed overlay enabled using the Tracks & Ground Speed option
Zooming and dragging the graph
To zoom and drag the graph:
- To zoom into the graph, click and hold the left mouse button, then drag the cursor over the area of interest.
- To drag the display area, right-click on the display area and drag the cursor in the required direction.
Selecting individual flight tracks
Flight tracks highlighted on the Track Profile graph are also highlighted in the Map Browser, and vice versa.
To highlight a single flight track, do one of the following:
- In the Track Profile graph, click the profile of the flight track of interest
- In the Operations Browser, select an operation
- On the Map Browser, select a flight track
Displaying track tags
The Track Profile graph can display tags for the selected track containing the highest level of flight identification available.
To display track tags:
- In the Track Profile toolbar, click Tags.
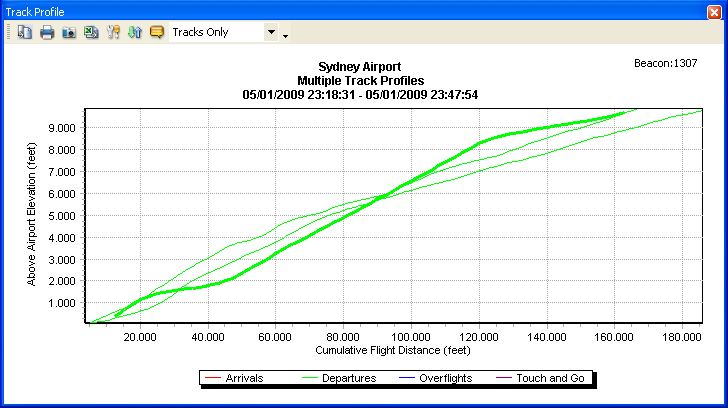
A track profile with the identification tag displayed for the selected track
Displaying cross-hairs to read exact values
The Track Profile graph can display a set of cross-hairs to help you analyse track profiles. Use them as a visual guide to determine the exact X and Y values of selected target points along a flight track.
To display cross-hairs:
- Populate the Operations Browser and display the tracks on the Map Browser.
- In the Map Browser toolbar, click Display Targets.
When you select a target point, cross-hairs appear on the Track Profile graph indicating the altitude and distance at that point.
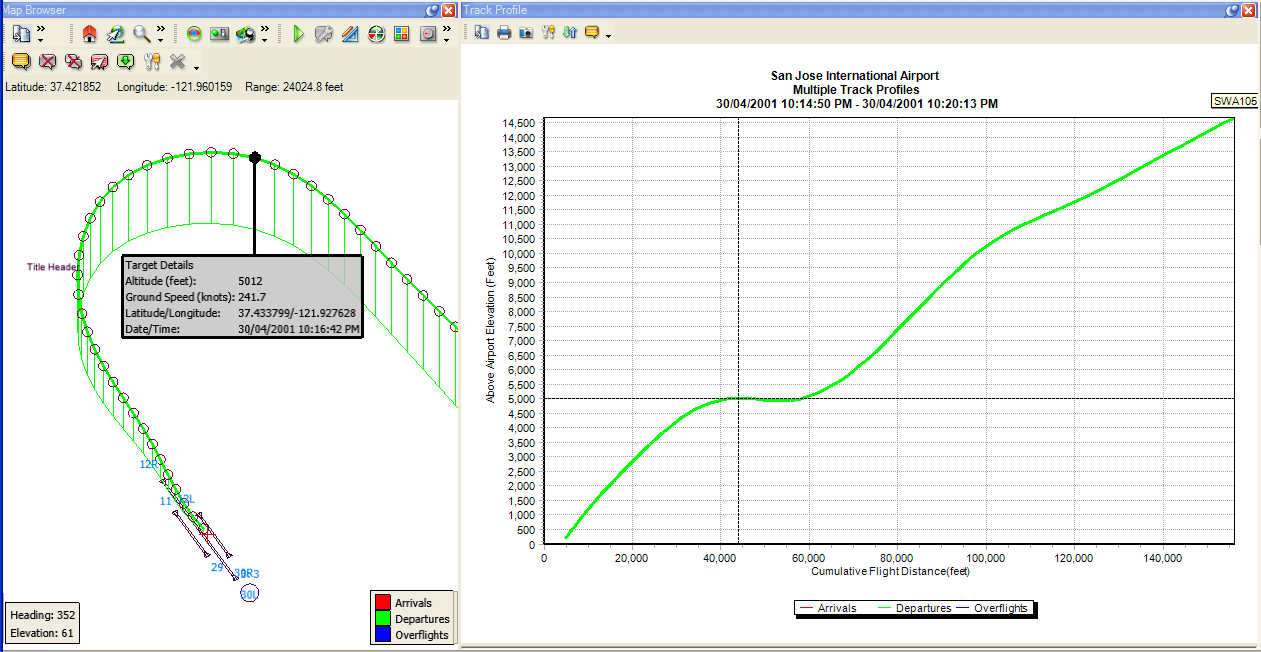
A selected radar target on the map with matching cross-hairs and target details on the Track Profile graph
Note: To display more details about the target point, use Map Tags.