


New article
Recently updated
Graphing noise events

Who is this article for?Noise analysts who need to graph noise event levels over time.
Access to the ANOMS Noise Analyst Workbench is required.
The Noise Events Graph displays a line graph of one-second noise levels for particular noise events, plotting noise level against time.
Understanding the Noise Events Graph
You can graph a single noise event or multiple noise events selected in the Noise Events Browser.
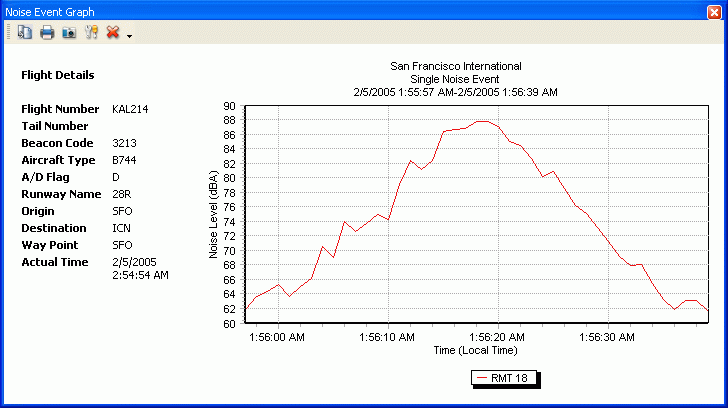
The Noise Event Graph showing a single noise event with the Flight Details panel for the correlated operation
Note: The noise metric displayed in the graph is Laeq (A-weighted Leq). This is different from Lmax, shown for each event in the Noise Events Browser: Lmax is the loudest one-second sample of the event, whereas Laeq is an equivalent A-weighted metric averaging the entire event.
You can also view the Flight Details for a noise event that has been correlated (linked) to an operation. This option is only available when you perform a linked query using both the Noise and Operations browsers.
Note: Noise events occurring at the same RMT are displayed in the same colour; each RMT is assigned its own colour.
Graphing a noise event
To graph a noise event:
- Load data into the Noise Events Browser.
- In the Noise Events Browser, select the noise event(s) you want to graph.
- Click Graph on the Noise Events Browser toolbar, or right-click the noise event and then click View Noise Events Graph.
The Noise Event Graph appears, displaying all the selected noise events.
Customising the graph's appearance
To customise the graph's appearance:
- On the Noise Events Graph toolbar, click Properties.
- To change the header and footer, enter new values in the Header and Footer boxes.
- To change the titles on the graph, type new titles in the X Axis Title and Y Axis Title boxes.
- To change the minimum and maximum values on the X and Y axes, enter new values in the X Axis and Y Axis maximum and minimum boxes.
Exporting, copying, and printing the graph
To export, copy, or print the graph:
- To export the graph as a graphic, click Export on the Noise Events Graph toolbar, then choose the image format you want (formats such as BMP, JPEG, or TIFF are available).
- To copy the graph to the clipboard, click Copy on the Noise Events Graph toolbar.
- To print the graph, click Print on the Noise Events Graph toolbar.
Zooming and panning
To zoom and pan the graph:
- To see more detail for an area of the graph, click and drag to the right around the area you want to see more detail for
- To reset the graph to the default maximum and minimum values, click and drag to the left
- To pan the graph, click and hold the right mouse button, then drag in the direction you want to pan