


New article
Recently updated
Using the Noise Events Browser

Who is this article for?Noise analysts who need to view and work with noise event data.
Access to the ANOMS Noise Analyst Workbench is required. Browser fields are site-configurable and may vary.
The Noise Events Browser displays information about noise events recorded during a specified time period, with the first row showing data field names followed by individual noise event records.
Understanding what you can do
You can use the Noise Events Browser to:
- Display noise event data for a specific time period
- Plot and print a graph of noise levels against time
- Print or copy the noise event data to the clipboard, or to an MS-Excel worksheet
- Edit noise event Correlation IDs
- Graph noise events
- View the frequency and tone for a selected noise event in a set of graphs that display 1/3 octave data
- Replay the audio of the noise event
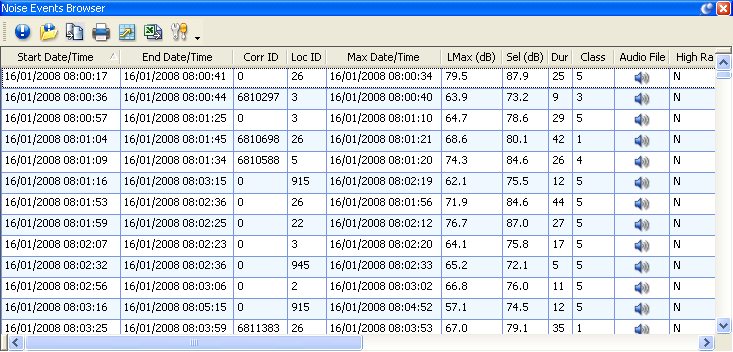
The Noise Events Browser populated with noise event records, including Correlation ID, LMax, SEL, Duration, Class, and Audio File columns
Opening the browser
To open the Noise Events Browser:
- Do one of the following:
- On the Browsers menu, point to Noise Events, and then click Open Noise Events.
- On the Main toolbar, click the Noise Events button.
- Press CTRL+SHIFT+N.
The Noise Events Browser window appears.
Loading data into the browser
To load data:
- Do one of the following:
- On the Noise Events Browser toolbar, click New Query to create a new query.
- On the Noise Events Browser toolbar, click Open Query to open an existing query.
Note: You can also use the Query Generator to create a query and display the results in the Noise Events Browser.
Understanding the toolbar
The buttons on the Noise Events Browser toolbar provide access to frequently used commands and functions.
Button | Use it to... |
New Query | Search for noise events in a specified date range |
Open Query | Load a saved query |
Copy | Copy selected noise events to the clipboard |
Print a selected noise event | |
Graph | Display the selected noise event in a graph |
Export to MS-Excel | Export the selected noise event to an MS-Excel worksheet |
Properties | Display the properties for the selected noise event |
Understanding the data columns
Column | Description |
Start Date/Time | Noise event start date and time |
Corr ID | Number linking noise event(s) to complaint(s) and operation |
Loc / Loc ID | Remote Monitoring Terminal (RMT) location number |
SEL | Sound Exposure Level (dBA) |
LMax | Maximum 1-second Leq level during the noise event |
Max Date/Time | Date and time of the maximum 1-second Leq of the event |
Duration | The length of the noise event in seconds |
Class | User-defined reclassification of the noise event (optional) |
Orig class | Original system classification of the noise event; see the article Noise event classification codes reference |
Event Number | The unique identifier assigned to the noise event |
Wind Speed | Wind speed recorded at the time of the noise event |
Wind direction | Wind direction recorded with the noise event |
Recog. Assessment | Indicates whether the recognition algorithm determined that the noise event was caused by an aircraft (if enabled; see the article What is the Recognition Assessment field?) |
Audio File | Location of the audio file for the event, if recorded |
Note: The fields in the Complaints, Noise, and Operations browsers may vary from the ones shown above, as these fields are configurable and site specific. Contact Ideagen support for additional information.