


New article
Recently updated
Using standard graphs in ANOMS

Who is this article for?Noise analysts who need to graph, customise and print browser data.
Access to the ANOMS Noise Analyst Workbench is required.
ANOMS provides standard graphs accessed from the Operations Browser (Track Profile graph) and Noise Events Browser (Noise Event graph), with consistent toolbar functions, properties and print options across both graph types.
Opening a graph
To open a graph:
- Populate the browser using a new or saved query.
- Select the required records.
- Click Graph on the browser toolbar.
The graph displays all selected records.
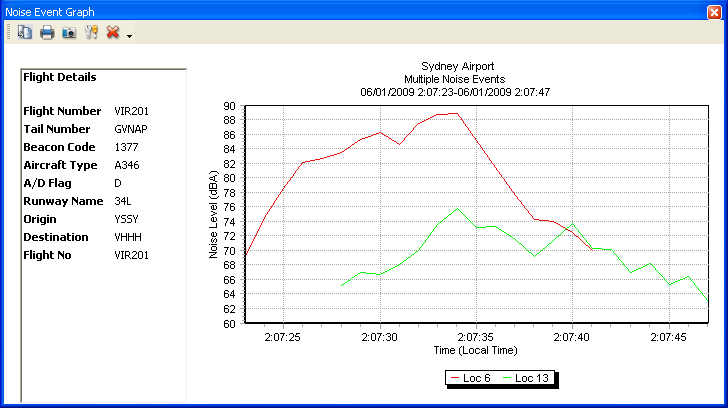
Note: If you select a plotted item on the graph, the corresponding record is highlighted in the browser. If you select new records in the browser, these are displayed on the graph. Use Ctrl+click to add rows to your selection.
Understanding graph functions
The graph toolbar provides the following functions:
- Copy – copy the graph to the clipboard
- Print – print the graph to a network printer
- Export – save the graph as a graphic file
- Export to Excel – export the raw data to an Excel file
- Properties – manage the graph's display properties (header, footer, axis titles)
- Tracks – display single or multiple tracks (single tracks include the flight's ground speed)
- Graph – create a Track Profile graph for the selected data (you can print, copy or export the graph)
- Tags – display flight details (Flight #, Tail # or Beacon)
Zooming in on the graph
To zoom in:
- Click at the top left of the area you want to magnify.
- Hold the left mouse button down and drag towards the bottom right.
- Release the mouse button.
Zooming out on the graph
To zoom out:
- Click at the bottom right of the graph.
- Hold the left mouse button down and drag towards the top left.
- Release the mouse button.
Panning the graph
To pan the graph:
- Right-click on the graph.
- Hold the button down and drag the mouse.
Changing graph properties
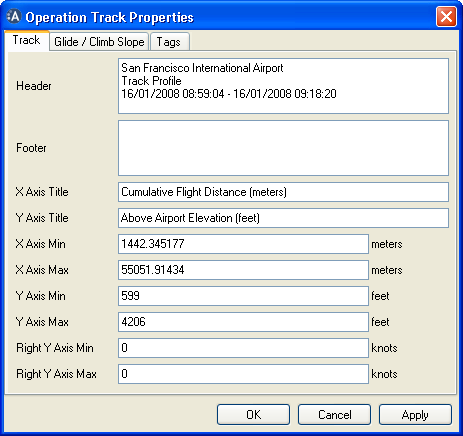
You can change the graph's appearance, including header and footer descriptions, axis titles, and axis minimum and maximum values.
To change graph properties:
- Load data into the browser and select the required record(s).
- Click Graph.
- In the graph window, click Properties.
- Change the required items:
- To change the header and footer, enter new values in the Header and Footer boxes
- To change the axis titles, type new titles in the X Axis Title and Y Axis Title boxes
- To change the axis ranges, enter new values in the X Axis and Y Axis minimum and maximum boxes
- To change the flight detail labels, click the Tags tab and select the required display tag from the list
- Click OK or Apply.
Printing a graph
To print a graph:
- In the graph window, click Print.
- Format the print as required:
- Change the page orientation
- Zoom in or out
- Change the margin settings
- Format the print quality
- Click Print.
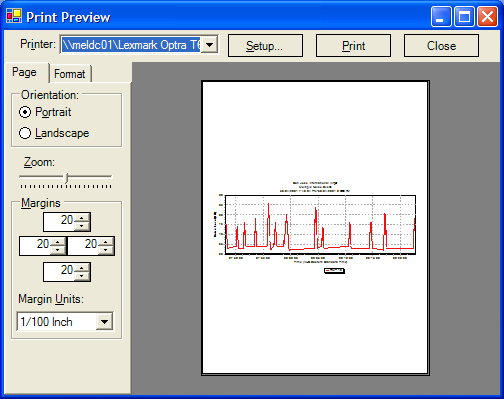
Note: The same print steps apply to both the Track Profile graph and the Noise Event graph.