


New article
Recently updated
Understanding Track Statistics for flight track dispersion analysis

Who is this article for?Noise analysts who want to understand flight track dispersion analysis.
Access to the ANOMS Noise Analyst Workbench is required.
Track Statistics analyses the dispersion of related flight tracks and draws averaged paths that represent that dispersion for modelling purposes.
Understanding Track Statistics
Track Statistics analyses the dispersion of related flight tracks — typically batches of flights using the same route or runway — and draws averaged paths that represent that dispersion for modelling purposes. The dispersion is calculated based on ground speed, vertically and horizontally, by route and runway.
Track Statistics can display a median path based on the sample, or show where a predefined percentage of the traffic flew, as well as providing graphs and other statistics.
Using Track Statistics capabilities
Track Statistics allows you to:
- View mean, median, and modal tracks on the map and on the Track Profile graph
- View a penetration graph that calculates and shows statistical information for the penetrations shown
- Provide a 2D display of the track dispersions for a selected corridor, with colour-filled segments
- Use graphs to view the distribution of tracks against speed, distance, and altitude when penetrating a route's gates
- View the graphical representation of the track distribution on the map
- Export the Track Statistics analysis result to an XML-formatted file
- Provide the basis for defining dispersion paths for use with noise modelling
Note: Track dispersion selection options are compatible with industry noise-modelling tools such as INM.
Understanding the four output displays
Track Statistics provides four types of output displays:
Output | Description |
Median Line | Maps to the middle track of all the operations. If 60 tracks are mapped, the median displays the track in the middle of the sample. |
Mean Line | The mean average track, calculated from all the tracks mapped. This is not an actual track but a compiled average, built from the average at each gate in the data. |
Mode Line | Depicts the segments of the gates with the highest number of intersections. Like the mean line, this is compiled from the calculated data: each gate in the analysis is split into equal-sized parts, and joining the parts on each gate produces a two-dimensional grid used for counting the number of intersections. |
Dispersion Layer | Calculated from the number of tracks and a percentage specified by the user (or the default if not set), colouring the paths based on those results. You can easily see where a given percentage of flights dispersed along the route. This layer can only be viewed on the map. |
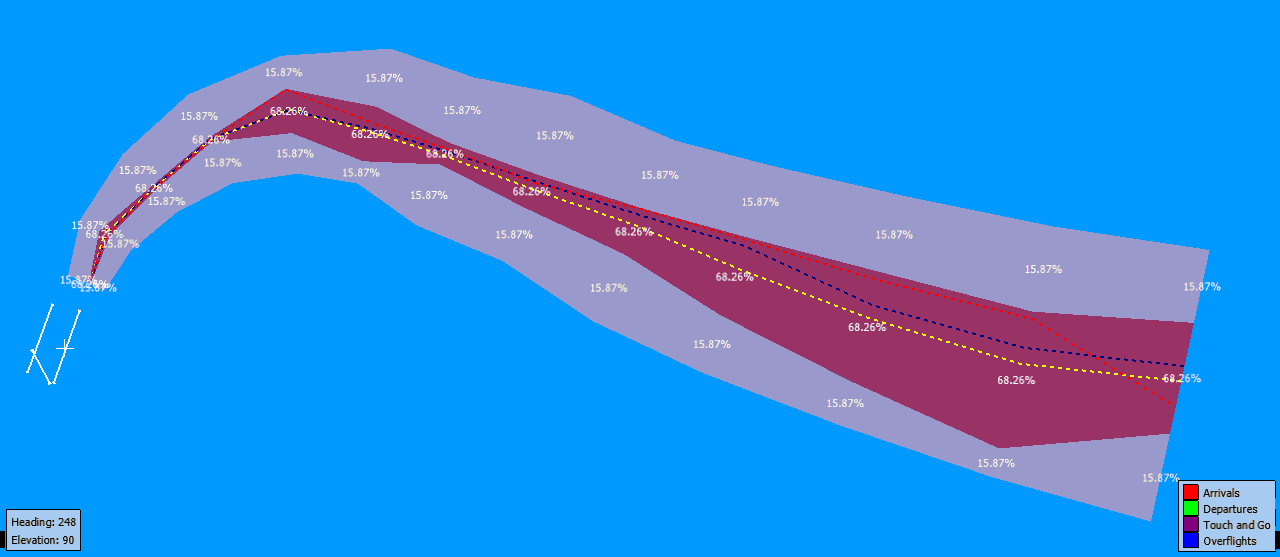
A Track Statistics result on the map: the dotted lines are the median, mean, and mode, and the coloured stripes are the dispersion layer percentages