


New article
Recently updated
Viewing Track Statistics on graphs

Who is this article for?Noise analysts who need to view dispersion results on gate or profile graphs.
Access to the ANOMS Noise Analyst Workbench is required.
Once a Track Statistics plot has been generated, its results can be viewed on the Penetration Gate (scatter plot) graph and on the Track Profile graph, as well as on the map.
Showing Track Statistics on a Penetration Gate graph
You can view generated Track Statistics through any gate using Penetration Gate Analysis (also known as a scatter plot). Any gate that crosses the currently generated Track Statistics plot can be used, or you can make a new gate for the purpose.
Note: The gate must cross an active Track Statistics result for any data to be displayed on the Penetration Gate Analysis window.
To display Track Statistics on a Penetration Gate graph:
- Load operations to the Map Browser.
- Open the Feature Manager to display a gate on the Map Browser, or create a new gate using the Gate/Corridor Editor.
- Open the Penetration Gate Analysis graph.
- Select the gate on the map.
- Open the Properties panel of the Penetration Graph.
- Select the Track Statistics tab.
- Select any or all of the Mean, Median, or Mode displays.
- Use the selector buttons, or enter a percentage value, to display the boundary lines.
The boundary lines indicate the percentage of traffic that penetrated the gate. The default setting is 100%.
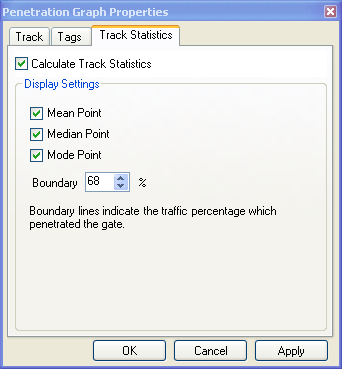
The Track Statistics tab of the Penetration Graph properties, with mean, median, and mode points and a boundary percentage
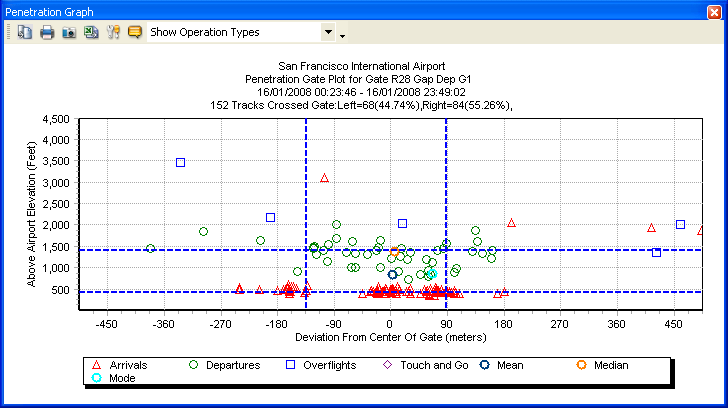
A Penetration Gate graph with Track Statistics displayed: the dashed vertical and horizontal lines are the boundary lines, with mean, median, and mode points marked
Showing Track Statistics on a Track Profile graph
If you have generated a Track Statistics plot, you can also view the mean, median, and mode lines on a Track Profile graph.
To display Track Statistics on a Track Profile graph:
- Generate a Track Statistics plot.
- Turn on one or more of the display controls (Mean, Median, or Mode) via the Track Statistics panel.
- Open a graph from the Operations Browser by clicking the Graph button.
The selected Track Statistics data is displayed on the Track Profile graph.
Note: The dispersion layer can only be viewed on the map.
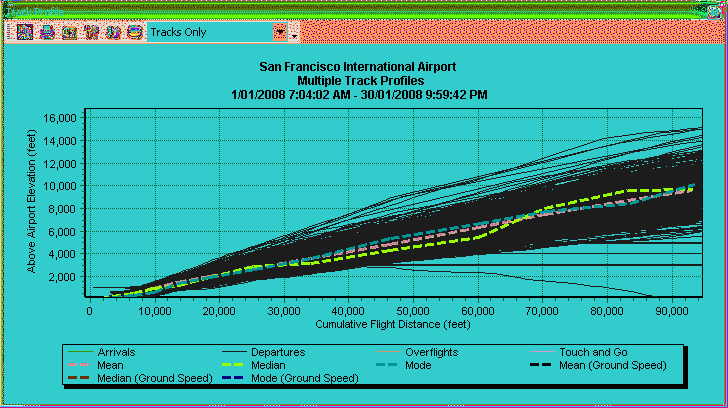
A Multiple Track Profiles graph with the mean, median, and mode statistic lines overlaid on the individual track profiles