


New article
Recently updated
Running Penetration Gate Analysis

Who is this article for?Noise analysts who need to analyse which flights pass through a gate.
Access to the ANOMS Noise Analyst Workbench is required.
Penetration Gate Analysis (PGA) displays flight track penetrations through a selected gate as a graph, showing exactly where each flight crossed.
Displaying the PGA graph
Use the Penetration Gate option under the Map menu, or the PGA button, to view and print a user-defined gate and the flight tracks that pass through it.
To display the graph:
- Populate the Operations and Map Browsers, then select the required track data.
- From the Map Browser, use Features to display the required gates and corridors.
- On the Map Browser, select the required gate or corridor.
- Click the PGA button.
Note: Flight tracks must first be loaded into the map display before they are available for graphing in the Penetration Gate window. Tracks loaded with Replay cannot be used with the Penetration Gate window.
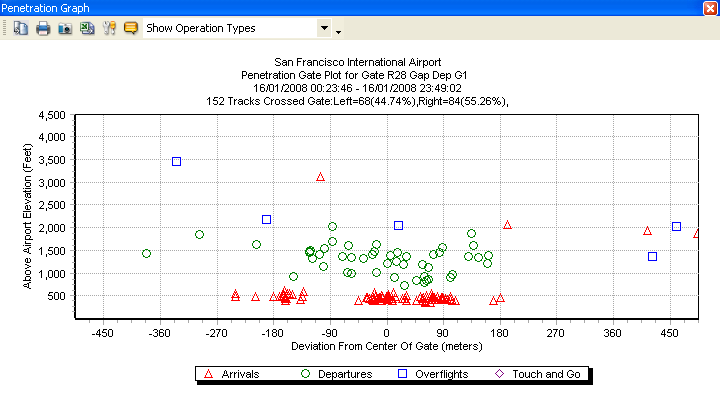
The Penetration Graph, plotting each track's crossing point by deviation from the gate centre and height above airport elevation
Reading the graph
Arrival, departure, and overflight tracks are displayed as different symbols, defined in the graph legend. Selecting a track highlights it and displays a cross-hair to help you read its altitude and deviation from the centre of the gate. The display can be adjusted and printed.
Axis | Name | Description |
X axis | Deviation From Center of Gate | Horizontal location of a flight track in the gate, measured negative (left) and positive (right) from the centre of the gate |
Y axis | Above Airport Elevation | Vertical distance, above the airport ground level, of an aircraft as it passed through the gate |
Selecting individual flights
Flight tracks selected in the Penetration Graph are also highlighted in the Map Browser and the Operations Browser.
To select a flight:
- Do one of the following: in the Operations Browser, select a track; in the Map Browser, select a track; or in the Penetration Graph, click on a symbol.
- The track is highlighted in all three windows.
Displaying cross-hairs
To assist in analysing tracks, a set of cross-hairs is displayed for the currently selected track. Use the cross-hairs as a visual guide to determine the exact X and Y crossing point of a track through the gate.
Displaying track labels
To label each point with the flight identification number of its track:
- On the Penetration Graph toolbar, click Tags.
Displaying penetration direction
Instead of operation type, the graph can show the direction each track passed through the gate, with a different icon for passing in or out.
To display penetration direction:
- On the Penetration Graph toolbar, open the drop-down list and choose Show Gate Penetration Direction.
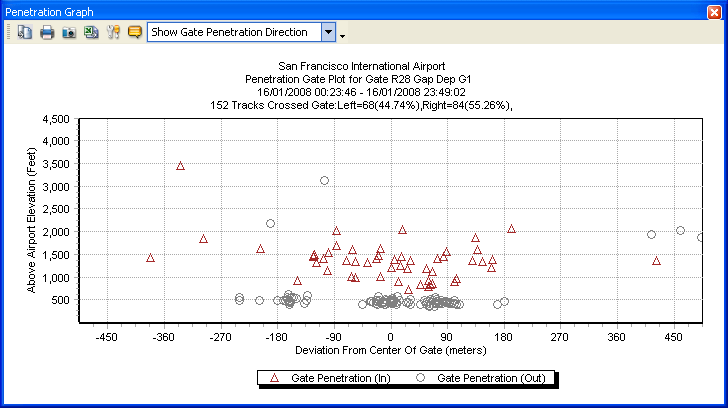
The Penetration Graph showing gate penetration direction, with separate symbols for tracks passing in and out of the gate
Exporting gate penetration data
To export the data:
- On the Penetration Graph toolbar, click the Excel button to export the gate intersection data to Microsoft Excel.
The export contains one row per penetration, with the series (operation type), the X and Y crossing values, and the operation number.